Visualising big data can often be a handy tool for upper level management. In a matter of seconds, you can see flu trends, popular areas in a city, internet outages, web fraud, what is popular in your shop, and much more. Handling huge amounts of data is usually restricted to a specialised few, but with heat maps, data becomes accessible to everyone. We have compiled a list of 3 heat maps that simplify massive data sets into neat visualisations.
1) Foursquare
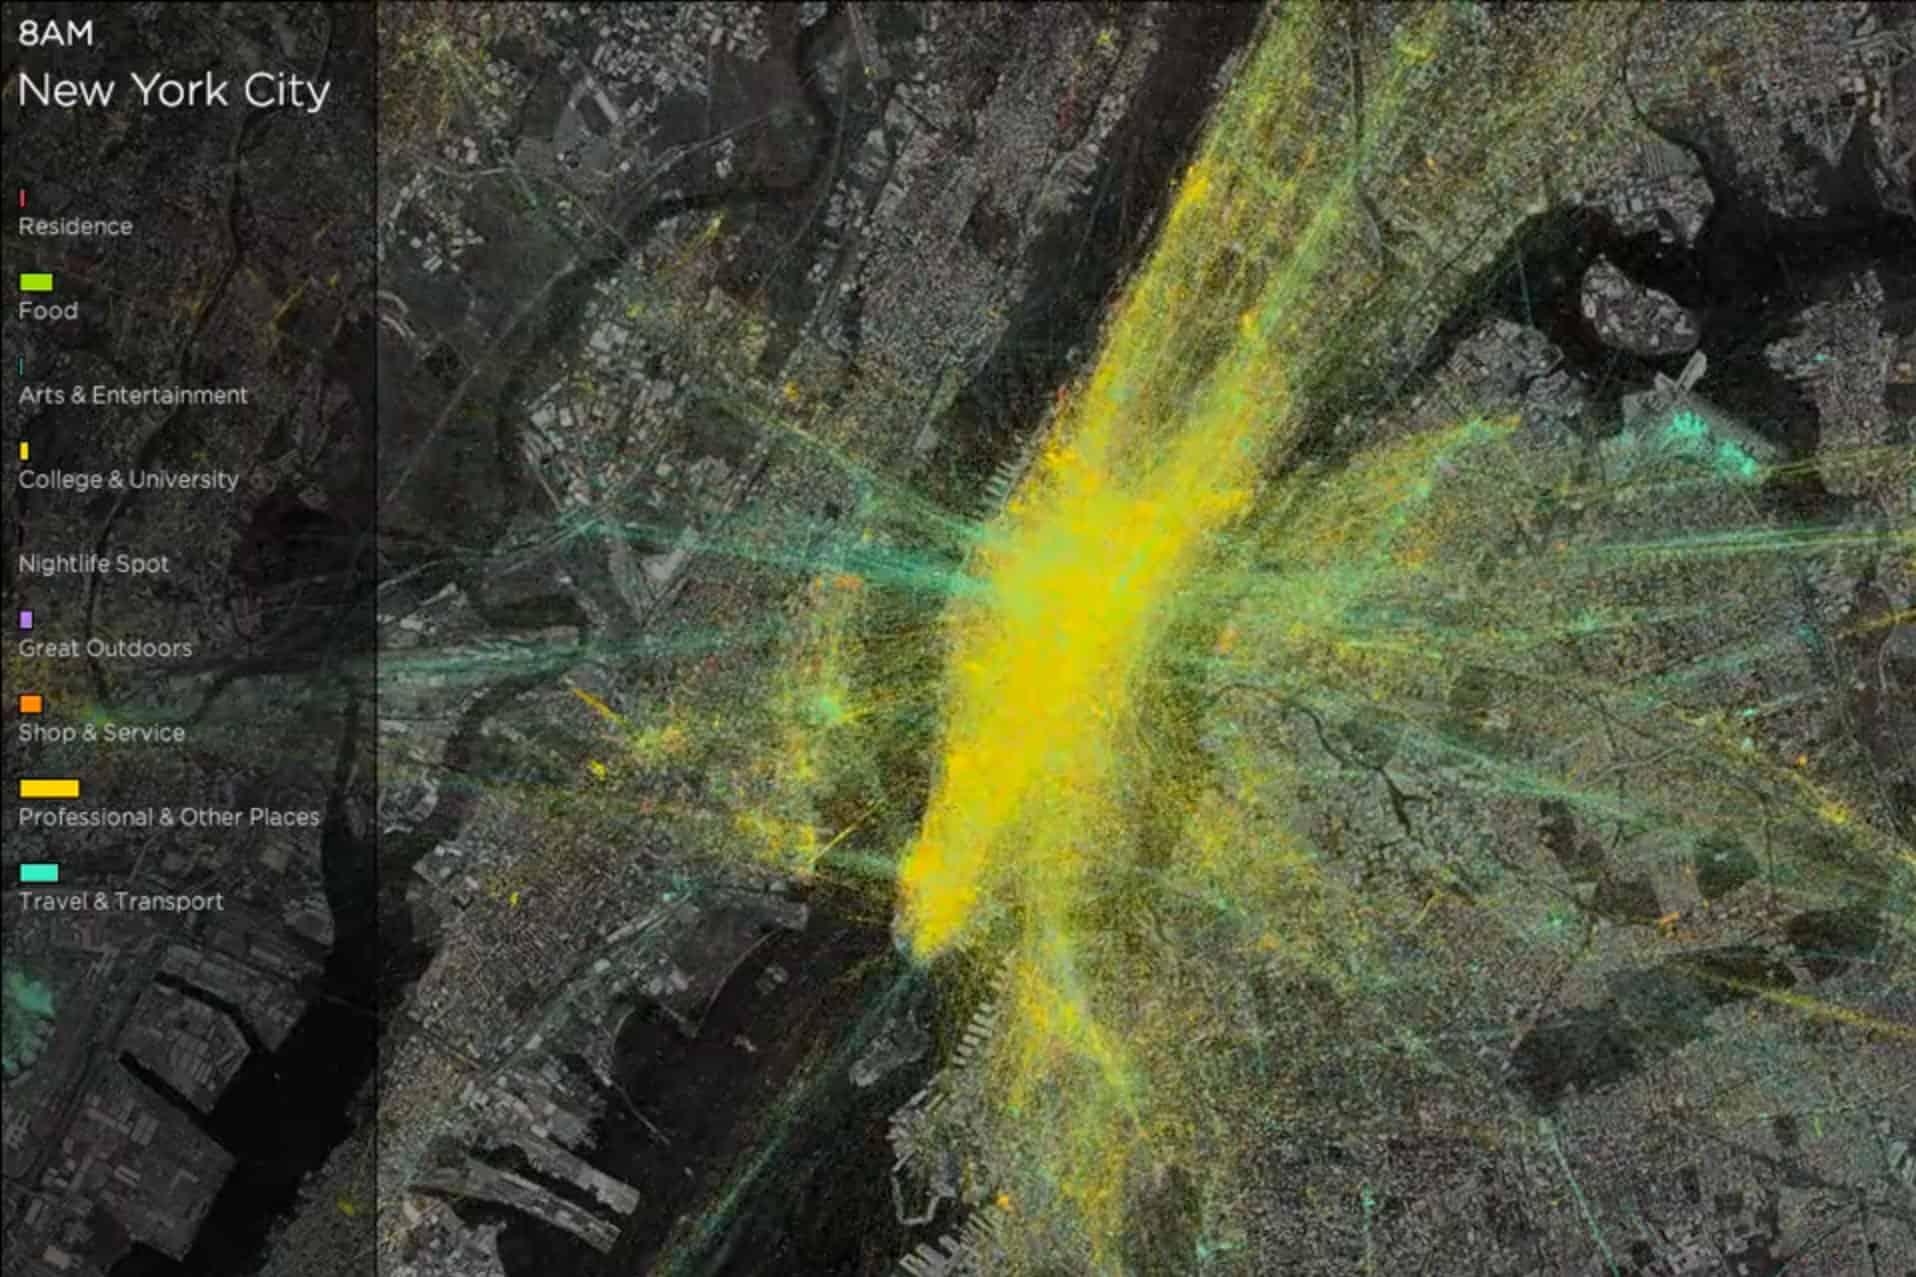
One of the most insightful collections of heat maps comes from Foursquare’s database of check-ins. Foursquare released heat map videos of 6 cities — New York, London, Istanbul, Tokyo, San Francisco and Chicago — where people can view the most popular destinations, travel times, and general movements of the population. This data is a handy tool for city planners to make informed decisions about where to direct their services.
You can view the collection here
2) ThreatMatrix
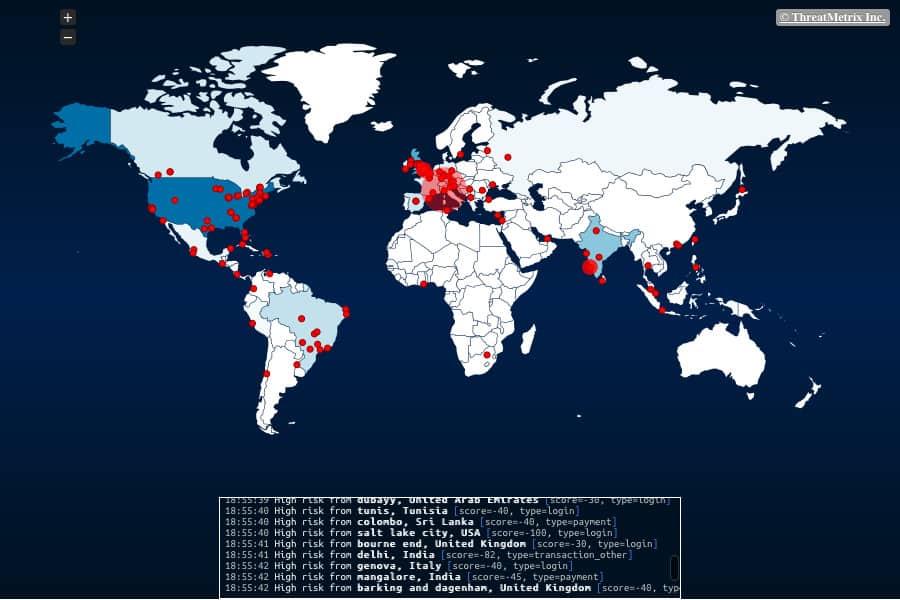
ThreatMatrix shows the location, and risk, of web-fraud across the globe. The heat map is in real time and provides a fascinating insight into the countries, regions and cities that are currently facing web fraud. ThreatMatrix uses data from 1,950 customers, including 9,000 websites and tracks approximately 360,000 cyberattacks a day. “Customers can use the data to correlate the high-number of attacks with their threat detection and blocking.”
You can view ThreatMatrix in realtime here
3) RetailNext
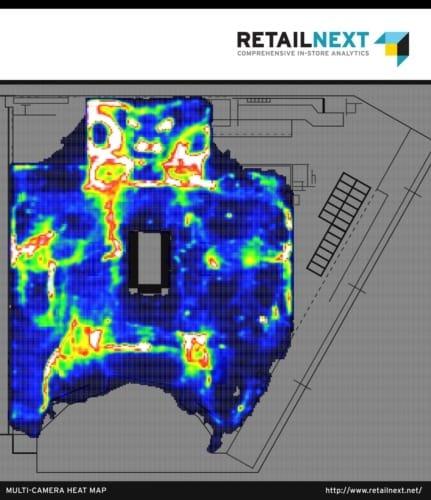
RetailNext is a fascinating example of “offline” analytics. The company offers a visualisation of customer behaviour in retail stores. The areas that are red represent the places where customers spend the most time. Through this information, retail stores can understand what product placements are working, see whether a sales campaign was successful, and even gauge whether the store should be re-organised.
You can view the RetailNext website here
(Image Credit: Trendsmap)


