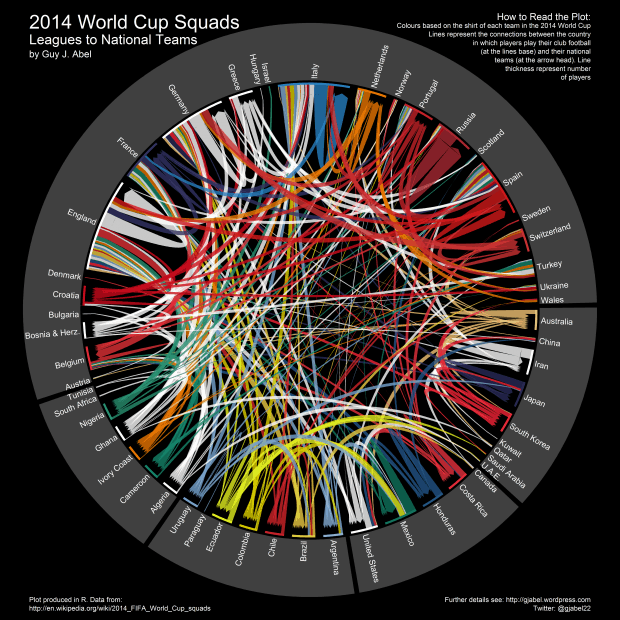
If you’re not sick of World Cup fever just yet, we have a few World Cup visualisations to brighten up your weekend.
The first is a visualisation showing how World Cup teams are drawn from league players around the world. Although you have to be a national citizen to play for on a particular country’s team in the World Cup, you don’t have to be a citizen to play in their leagues. This visualisation by Guy Abel, a statistician and R programmer at the Vienna Institute of Demography, shows where members of the World Cup team usually play around the world. The arrows flow from the World Cup teams to the players’ regular league teams. Arrows folding back on themselves denote players who play in league teams from their own country (check out Russia and Italy, for example). The visualisation was created in R using the Circlize package and data scraped from Wikipedia; you can access the code for this plot on Github.
 The second is a much less data-heavy visual history of the final stadiums of the World Cup (click here to enlarge). Grass Form, the creators of this infographic, had this to say:
Of course part of the World Cup legend are the iconic stadia; from the timeless twin towers of Wembley to the newly-revamped Maracanã which will take pride of place at this year’s tournament, these coliseums have provided the platforms for the most iconic moments in the history of the game.
Interestingly, the infographic shows the capacity of each stadium too. The Estadio Do Maracana, the home of the World Cup this year, hosts 96,000 people; compare that to Stade de Olympique de Colombes, home of the 1938 World Cup which seated a paltry 14,000 people.
If this article hasn’t sated your appetite for all things World Cup, you should check out our posts on using data to predict the World Cup winner, and how the German team are using big data to gain the competitive edge.
(Sources: Cool Infographics, Revolution Analytics)


