When we need to measure marketing campaigns, most of us have cracked online campaign tracking – we have a cookie or a user ID that we can use to clearly track user behaviour through to conversions, and develop robust datasets. But out in the offline world, there are powerful channels like TV and radio that marketers typically treat like a black box where cash goes in and very little data comes out. Long-term brand effects are similarly tricky to analyse.
But the good news is, you can measure anything if you have the right tools – and in these cases, you won’t even have to train an AI. All of the following solutions use tried-and-true statistical analyses to unlock insights you probably didn’t think you could access.
1. Immediate Response (TV or Radio Campaigns)
For channels and use cases where customers tend to use a device in parallel to seeing or hearing an ad, and where you know the exact timings of marketing activities, you can measure immediate response. With TV and radio, for example, you have data on when each individual spot airs, as well as traffic and user data from your web or mobile site or app. You can compare the airing times to user response immediately following the ad using a real-time statistical algorithm.

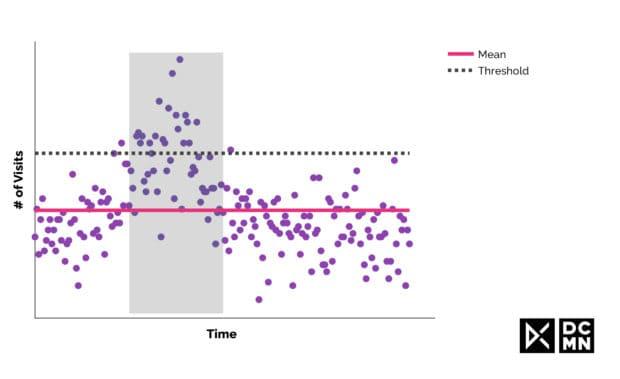
Immediate response of a TV spot airing at the beginning of the grey window. All visits above the threshold within the window are attributed to the spot.
The KPIs: Web and mobile site visits, app usage or installs.
The method: Measure peaks in visits and installs that are significantly higher than normal, day-to-day traffic fluctuations, if they happen directly after an airing. Attribute this traffic to those individual airings.
What to watch out for: Make sure to filter the traffic so it’s limited to sources that have a high likelihood of coming from that specific campaign. This requires domain knowledge on how users arrive on your site or app. Also, traffic fluctuates for reasons other than marketing campaigns. Having a threshold in place that changes dynamically based on these fluctuations is crucial in deciding whether subtle changes are due to a spot airing or just noise.
2. Short-Term Response (Radio or Billboard Campaigns)
As well as immediately responding to marketing activities, customers can also respond with a delay of a few hours or days after they’ve seen an ad. This is the case for radio or billboard campaigns, where users might visit your website or use the app once they’re back at home, or they have some free time on the weekend. Their responses won’t show up in the above method for immediate response measurement, so we need a more refined model.

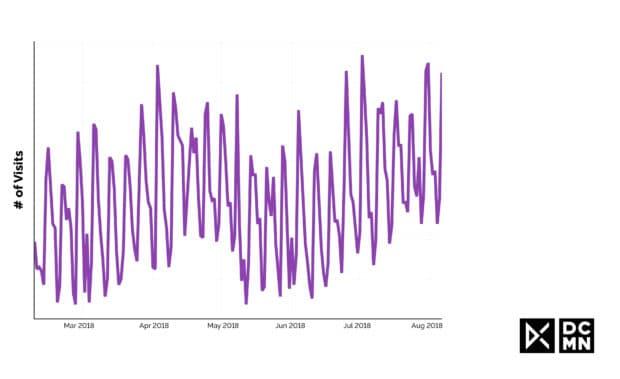
Long-term traffic pattern of visits on a website. During the last two weeks of this time series, there is a radio campaign running and we need to identify whether there is impact, and how much.
The KPIs: Web or mobile site visits, app usage or installs, or even brick-and-mortar store visits.
The method: With Bayesian modeling, you can analyse the time-series data of customer responses when you have some prior knowledge of what other factors might affect the campaigns. It needs to cover all possible effects, saturating trends, the change-points of the trend, multiple patterns of seasonality, and additional external events like holidays and product launches.
What to watch out for: This is a labour-intensive method that needs a lot of experience in evaluating models, as well as domain knowledge (e.g. knowledge of the channels and the business model). Without this, it will be difficult to define the best parameters and make sure you find the most accurate model within a reasonable amount of time.
3. Long-Term Brand Impact
Marketing campaigns don’t just drive users to your site or store in a one-off event – over time, they’ll contribute to the long-term value of your brand. Different channels may even have a cumulative effect on each other’s effectiveness, which makes this a challenging phenomenon to measure. To do this, you need a combination of different methods.

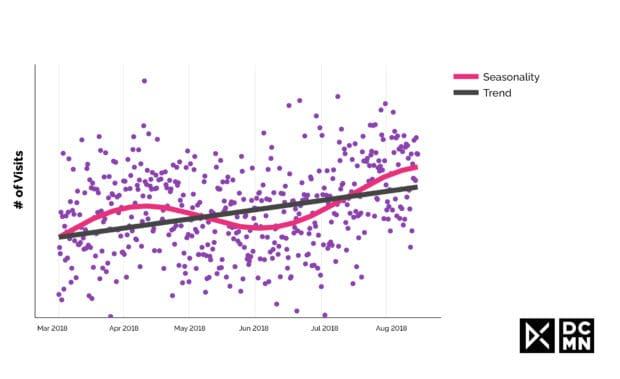
Long-term traffic that has two underlying patterns: trend and seasonality.
The KPIs: Long-term trends in brand awareness and affinity, but also conversions (e.g. purchases and app activity). Here you can focus more on further-down-the-funnel KPIs and higher-value conversions, which can then be used to analyse and optimise campaigns on the basis of customer lifetime value.
The method: A tried-and-true way to measure long-term brand impact is with market research. Here you can monitor consumers’ long-term awareness of your brand and their affinity to it within the target group or a general population. For a slightly more complex method, but one that provides deep insights, you can again use Bayesian models to capture all possible sources for trends and changes. First, clean your time series data of all repeating seasonal patterns or other events that possibly impact conversions, then check for long-term trends along change points, correlating them with known marketing activities.
What to watch out for: In addition to the short-term response, the model you use needs to explain long-term halo effects, where one channel will cumulatively increase the effectiveness of other channels. For example, TV advertising will also have an impact on display advertising and retargeting, which needs to be taken into account.
4. Cross-Media Campaigns
It’s rare that ads are running on just one channel at a given time – for example, you might supplement a TV campaign with radio, billboard, and display ads. To get a complete picture of all these activities, you’ll want to understand the impact of each of these different channels. Once again, Bayesian statistics comes to the rescue.

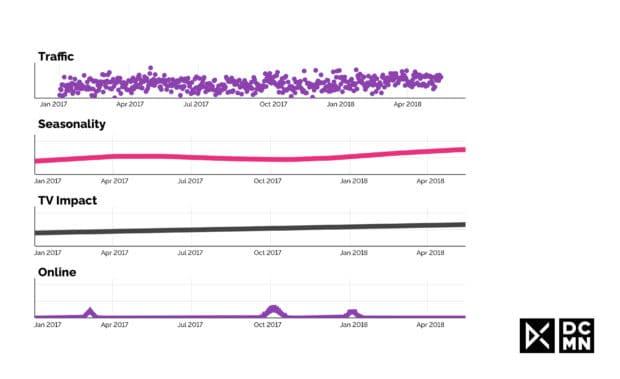
Top row shows a long-term traffic pattern, which is comprised of 3 ingredients: Repeating pattern from seasonality, a long-term upwards trend, and three bumps in traffic caused by online marketing activities.
The KPIs: The individual KPIs might vary per channel, but in this method you’ll look closely at the strength of the cross-correlation of all your marketing channels and then their individual correlation to visits and conversions.
The method: Similar to the above method, we can use a Bayesian regression analysis to understand the impact of each channel. By using hierarchical models (e.g. comparing historical data of typical sales patterns for a vertical with your own sales patterns), you can handle more complex models and take many different channels and factors into account. Again, you’ll need to include additional factors that have an impact on visits and conversions into the parameters of your model, such as holidays or weather patterns.
Hierarchical Bayesian models can deliver deep insights even with small datasets, which are typical in these contexts where you may have just one point of data per channel per day. Additionally, Bayesian statistics provides a measure of uncertainty for the model itself, to benchmark optimisation of the marketing channels. Recent work in this field has shown great results with this kind of modeling.
What to watch out for: Challenges in this sort of analysis are the limited amount of data, channels that are strongly correlated (like if a marketing manager books Facebook and display advertising at the same time), and having to identify the many individual factors that might have an influence on user behaviour.
What Else Can I Measure?
Long answer: There are so many tried-and-true statistical models at our disposal that can show us (hopefully strong!) correlations between our advertising activities and user behaviour. Bayesian statistics gives us a powerful method to measure the effects of any marketing activity on any user behaviour, so long as we have data – even when the datasets are small, and even when campaigns overlap. Also, this kind of analysis gives us additional information about how closely the model fits the actual data collected. This tells you how much you can rely on the results, so you know how confident you can be in making business decisions. The caveat is, you need deep domain knowledge of the industry, business model, marketing channels, and local markets to make sure your model is taking everything into account.
Short answer: You can measure (nearly) everything – you just need domain knowledge and the right tools.


