 Success stories of how data-driven practices can revitalise businesses are rife today, but there are few as compelling as the story of Ford. In 2006, the legendary car manufacturers were in trouble; they closed the year with a $12.6 billion loss, the largest in the company’s history. As we reported earlier in the year, through implementing a top-down data-driven culture and using innovative data science techniques, Ford was able to start turning profits again in just three years. I was recently lucky enough to speak with Mike Cavaretta, Ford’s Chief Data Scientist, who divulged the inside story of how data saved one of the world’s largest automobile manufacturers, and well as discussing how Ford will use data in the future.
As an overview, how do Ford use data science?
So at the moment, we’re primarily trying to break down our data silos. We have a number of projects that are using Hadoop, and we’re actually setting up our Big Data Analytics Lab, where we can run our own experiments and have a look at some of the more research questions.
Back in 2006/07, Ford was having a downturn. Since then, it’s dramatically turned things around. What role did data science play in this?
Thanks for that question, and thanks so much for phrasing it as “data science” and not “big data”. I think at this point in time, “big data” has come to mean so many things to so many people, I think it’s better to focus on the analytical techniques, and I think data science does a pretty good job of narrowing in on that.
So back to 2006-2007- that was around the time Alan Mulally was brought on. He brought with him this idea that important decisions within the company had to be based on data. He forged that from the very beginning, and from the top down. It really didn’t take a long time for people to realize that if the new CEO is asking, “Hey where is the data you are basing your decision on?”, you’d better go out and find the data, and have a good reason why that data matters to this particular decision.
So, it became apparent quickly that we needed people who could manipulate the data. We didn’t call it “data science” at the time, but being able to bring data to bear against different problems became of primary importance.
The idea was that the roadmap really needed to be based on the best data that we had at that time, and the focus was not only good data and analysis, but also being able to react to that analysis fast.
So an 80% solution would allow us to move quickly, and benefit the business more than a 95% solution where we missed the decision point. I think there were a lot of benefits to being able to bring these methods, ideas and data-driven decisions using good statistical techniques. This approach helps to build your credibility, as you’re able to bring great results with good timing- it just worked out well.
What technologies were you using?
At the time, the primary technologies we were using were really on more on the statistical side, so none of the big data stuff- we were not using Hadoop. The primary database technologies were SQL-driven. Ford has a mix of a lot of different technologies from a lot of different companies- Microsoft, Teradata, Oracle… The database technologies allowed us to go to our IT partners and say “This is the data that is important, we need to be able to make a decision based on this analysis”- and we could do it. On the statistical side, we did a lot of stuff in R. We did some stuff with SAS. But it was much more focused on the statistical analysis stuff.
What technologies have you since added?
So I think the biggest change from our perspective is a recognition that the visualization tools have got much better. We are big fans of Tableau and big fans of Qlikview, and those are the two primary ones we use at Ford.
We’ve done a lot more with R and we’re currently evaluating Pentaho. So we’ve really moved from more point solutions for solving particular problems, to more of a framework and understanding different needs in different areas. For example, there may be certain times when SAS is great for analysis because we already have implementations, and it’s easier to get that into production. There are other times when R is a better choice because it’s got certain packages that makes that analysis a lot easier, so we’re working on trying to put all that together.
You’ve now begun to collect data from the cars themselves- what insights has this yielded?
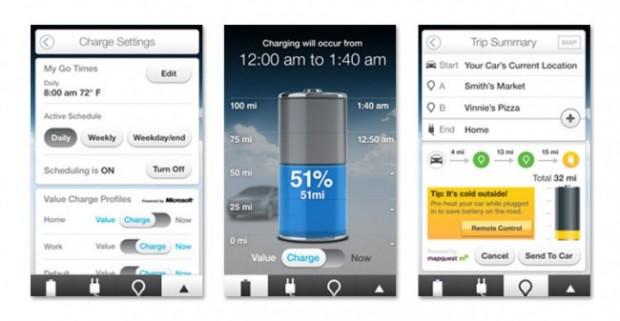
So there’s a good amount of analytics that can be done on the data we collect. It’s all opt-in data- it’s all data that the customers have agreed to share with us. Primarily, they opt-in to find charging stations, and to better understand how their electric vehicles are working. A lot of the stuff we are looking at has to do with how people are using their vehicles, and how to make sure that the features are working correctly.
Ford use text mining and sentiment analysis to gauge public opinion of certain features and models; tell us more about that.
So a lot of the work that we’ve done to support the development of different features, and to figure out what feature should go on certain vehicles, is based on what we call very targeted social media. Our internal marketing customers will come to us and ask us, “We’re thinking about using this particular feature, and putting it on a vehicle”- the power liftgate of the Ford Escape is a good example, the three-blink turn signal on the Ford Fiesta is another one. In those circumstances, we will take a look at what most people think about the features on similar vehicles. What are they saying about what they would like to see? But we don’t pull in terabytes of Twitter and we don’t use Facebook- we go to other sources that we found to be good indicators what customers like. It’s not shotgun blasts, so to speak; it’s more like very specific rifle shots. This gives us not only quantitative understanding- this customer likes it and this customer doesn’t- but also stories that we can put against it. And these stories are usually when the customers are talking with each other. One great story is for the three-blink turn signal when one customer was describing, “So I got the vehicle. I got the three-blink turn signal and I’m not sure whether I like it or not.” And other people were chiming in saying “You know what, I kind of got the same impression, give it another couple of weeks and just think about how you’re using it on the highway and if you give it a couple of weeks you’ll like it.”
The first person signed back on a few days later and said “You know you what, you were right, now that I understand how it works and where it should be used- I think I like it now!” It was actually kind of beautiful, and that story we can put in front of people and say “This is the way people are using it, these are the some of things they’re talking about”. So now, we’re not only getting the numbers, but also the story behind it. Which I think is very important.
What can we expect from Ford in the future?
I think the position that we’re in right now is really looking at instantiating the experiments we want to do in the analytics space, linking up the different analytics groups, and really focusing on the way that big data technologies allow us to break down data silos.
This company’s been around for over 100 years, and there’s data in different areas that we’ve used for different purposes. So we’ll start looking at that- and start providing value across the different spaces. We’ve put some good effort into that space and got some good traction on it. I can see that as an area that’s going to grow in volume and in importance in the future.
(Featured Image Credit: Hèctor Clivillé)


