With the recent furore among cab drivers about the growing prominence of Uber in London, Paris, Milan, Madrid and Berlin, we thought it would be interesting to see how the mobile-app, car-for-hire company uses big data to better its services. Below are 2 ways Uber has used data to understand the behaviour, location, and preferences of their customers, as well as interesting correlations between crime rates and Uber usage. We were surprised by the results, and thought our readers might be too.
1) Prostitution and Alcohol Promote Uber Usage
A few years ago, Uber’s team of data scientists (only three at that point) were trying to understand how to effectively manage the positioning of cab drivers in order to allocate them to the busiest areas at the right times. Of course, for Uber, this activity is crucial – by knowing that there is a Nicks game on a Saturday, for example, the company can have a line of cab drivers in the area to match the inevitable demand. At its core, this is quite unsurprising; Uber’s business model is predominately based on customer satisfaction and if customers are left waiting for a cab, Uber gains a bad reputation.
But therein lay the problem: what factors does one consider when deciphering why an area is busy? Looking at population density, the number of bars and business, and where people live in a given area could be one solution. However, what Uber did was look for something quite unusual. After they crunched some data and understood the areas and neighbourhoods that were most busy in New York and California, they decided to look for something more specific – crime.
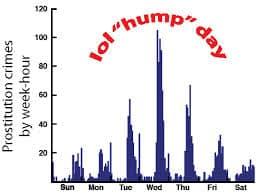
What they found was that those neighbourhoods where crime – prostitution, alcohol, theft,
and burglary – was most prevalent, were also the neighbourhoods most positively correlated with frequent Uber trips. More specifically, the team at Uber found the most 
heavily correlated crime was prostitution. What’s interesting is that prostitution had a considerable spike on Wednesdays, which happened to be at the same time Social Security and welfare checks arrived.
Of course, the team were quick to point out that this effect most probably reflects population density in terms of where people socialise, and that it in no way suggest causation. However, Uber’s Data Evangelist, Bradley Voytek did comment,
“This one of the coolest things about working for a data-driven company like Uber: on the surface we’re a transportation company, but below the hood there are so many ways to look at our data…This finding is a perfect example of the fascinating insights you can get when you combine big, seemingly disparate datasets. By trying to figure out how to predict where to position our cars, we got a peek at the ebb and flow of the life and crimes of San Francisco”
2) Calculating the The Walk of Shame
Almost a year after the aforementioned case study was conducted, Uber released another interesting post about the infamous “Walk of Shame,” which was renamed by the Uber office as “The Ride of Glory” (RoG). Now, to understand the definition of someone who takes “The Ride of Glory”, Voytek says,
“A RoGer was defined as anyone who took a ride between 10pm and 4am on a Friday or Saturday night, and then took a second ride from within 1/10th of a mile of the previous nights’ drop-off point 4-6 hours later (enough for a quick night’s sleep).”
After analysing the patterns of RoGer’s in San Francisco, New York, DC, Seattle, Chicago, NYC, the following results emerged:

Boston, as witnessed, was a clear winner — they had the most RoGer’s of the group.
But what about the correlation between certain days of the year? Uber looked at this too and surprisingly found that “brief overnight stays” dropped considerably during Valentines Day, whereas there was an influx in cab hiring on tax day (April 15th). Both are equally interesting, but the latter more so. According to Voytek, “an influx of cash might be making people more…frisky”).

“The areas that were most populated with RoGer’s in California”
Finally, Uber wanted to understand if there was a correlation between Rides of Glory and gender. They found that the greater the male/female ratio, the more likely for that neighborhood to “spawn” a Ride of Glory. As Voytek aptly concluded,
“You people are fascinating”
For more blog posts related to Uber, visit their blog here
Interested in more content like this? Sign up to our newsletter, and you wont miss a thing!
[mc4wp_form]
(Image Credit: Samantha Jade Royds)


